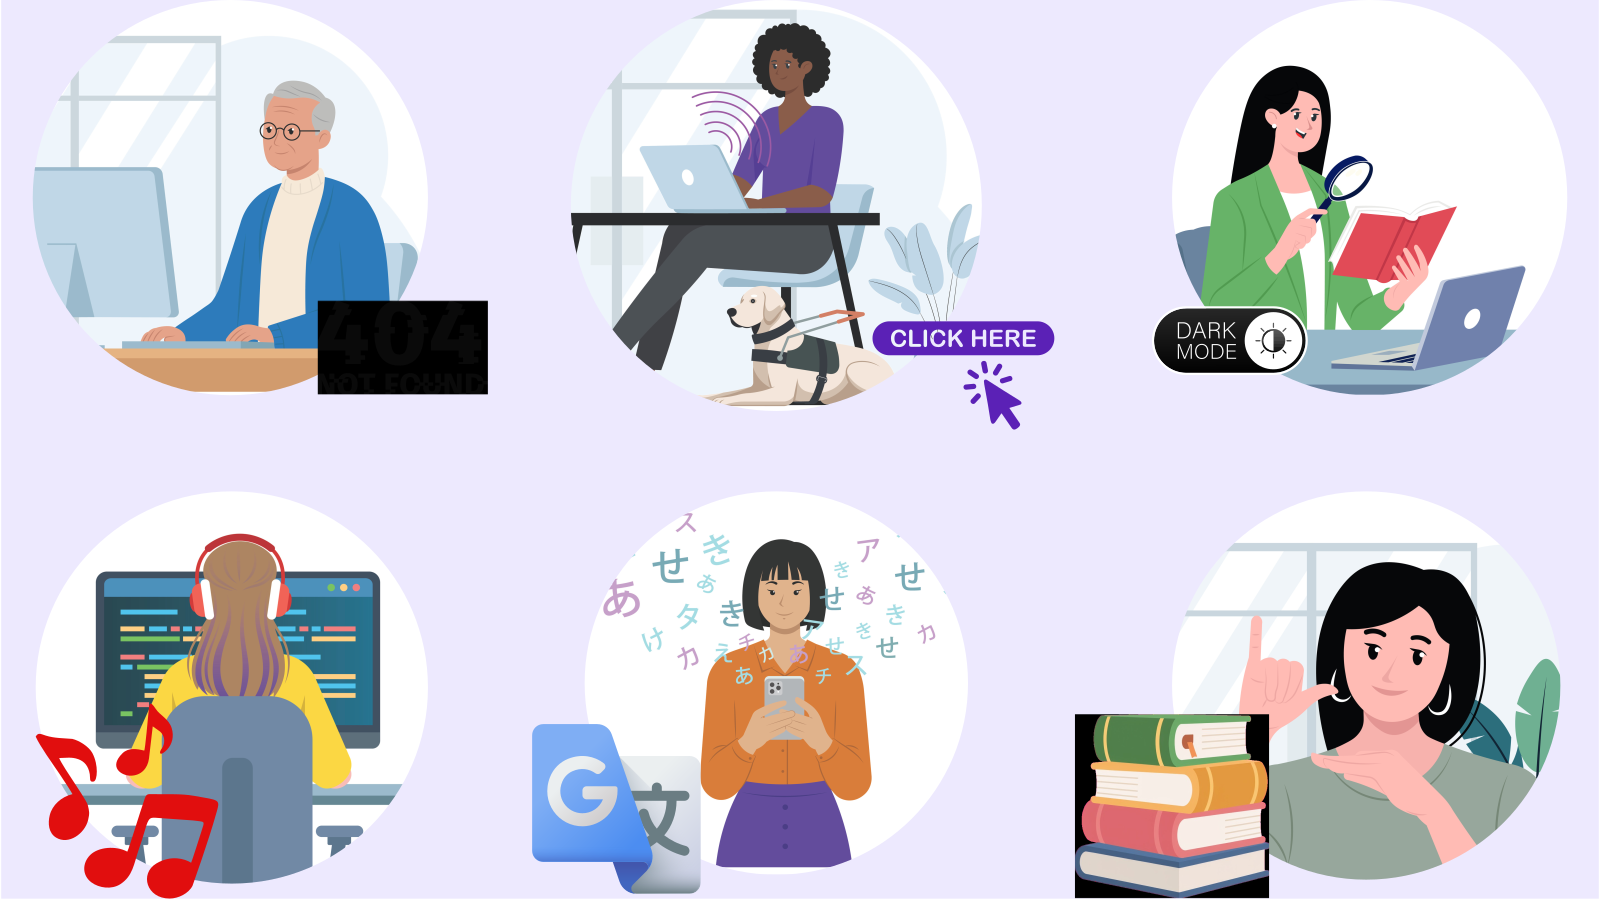
Key data points
- Findings from blind participants are tagged as accessibility-related friction 37.4% of the time, the single most concentrated pattern in the dataset, and 1.93x more common than the average across all cohorts.
- Findings from Indigenous participants are tagged as “content not found” 45.3% of the time, 2.09x the average rate, the strongest overrepresentation of any cohort-friction pairing measured.
- Deaf participants’ findings are dominated by comprehension friction (40.9%, 1.41x average), and limited-English-proficiency participants show a near-identical pattern (37.4%, 1.29x average).
- Physical disability findings are 1.83x more likely than average to involve “excessive effort” and 1.78x more likely to involve an unresponsive interface, both consistent with motor and precision-based interaction barriers rather than comprehension or access barriers.
- Testers aged 65+ show elevated “confidence” friction (1.40x average) and “excessive effort” (1.54x average), patterns consistent with hesitancy and second-guessing rather than an inability to complete the task.
Averaging across disability groups hides the real pattern
When usability findings are pooled into a single “friction type” breakdown, the dominant categories are comprehension (28.9% of all cohort-tagged findings) and content-not-found (21.7%), with accessibility-specific friction close behind at 19.4%. That headline mix is true on average, and almost meaningless for design decisions, because it obscures the fact that different cohorts are not failing for the same reasons. Comparing each cohort’s friction-type distribution to the overall average, rather than to each other, reveals a distinct “signature” failure pattern for most of the nine groups tracked across these 15 studies.
The friction signature for each cohort
| Cohort | Findings (n) | Dominant friction type | Share of that cohort’s findings | vs. average |
|---|---|---|---|---|
| Blind | 781 | Accessibility | 37.4% | 1.93x |
| Indigenous | 75 | Content not found | 45.3% | 2.09x |
| Deaf | 303 | Comprehension | 40.9% | 1.41x |
| Limited English proficiency | 596 | Comprehension | 37.4% | 1.29x |
| Over-65 | 291 | Content not found | 27.8% | 1.28x |
| Low vision | 589 | Accessibility | 25.0% | 1.29x |
| Physical disability | 89 | Excessive effort | 13.5% | 1.83x |
| Neurodivergent | 466 | Excessive effort | 9.9% | 1.34x |
(Cognitive disability is excluded from this table due to an insufficient sample size, n=7, in the current dataset.)
Reading the signatures
Blind and low-vision testers: an operability problem, not a comprehension problem. Both cohorts are overrepresented on accessibility-tagged friction specifically (1.93x and 1.29x respectively) rather than on comprehension or content-findability issues. This is consistent with the pattern seen across this dataset more broadly: once content is reachable via a screen reader or magnification, these testers generally understand it, the barrier is whether the interface can be operated at all with assistive technology, not whether the language or layout makes sense.
Indigenous testers: the strongest single signal in the dataset is about findability, not disability-specific access. A 2.09x overrepresentation on “content not found” (nearly half of all findings for this cohort) is a materially different pattern from every other group, and doesn’t fit a purely assistive-technology framing. It’s consistent with a trust and wayfinding problem: content that technically exists but isn’t presented, worded, or positioned in a way this cohort expects to find it, which points toward information architecture and content strategy rather than interface engineering as the relevant fix.
Deaf and limited-English-proficiency testers share a comprehension signature. Both cohorts are overrepresented on comprehension friction at almost the same rate (40.9% and 37.4% respectively) despite having very different access needs. This is a useful reminder that captioning and translation are necessary but not sufficient: the underlying issue in both cases is frequently about plain language, sentence complexity, and unexplained jargon, which persists even once content is technically accessible in the relevant format or language.
Over-65 testers show a hesitancy pattern, not an inability pattern. The elevated “confidence” friction (1.40x) and “excessive effort” (1.54x) combination is distinct from the accessibility-dominant pattern seen in blind and low-vision testers. These findings typically describe testers who can complete the task but do so more slowly, with more hesitation, second-guessing, or a need for reassurance, a pattern that calls for clearer feedback and confirmation states rather than structural accessibility fixes.
Physical disability testers show a motor-interaction signature. The 1.83x overrepresentation on “excessive effort” and 1.78x on “unresponsive interface” (the highest of any cohort for that second category) is consistent with interfaces that assume precise pointer control, tight timing windows, or small touch/click targets, none of which are captured by screen-reader-focused accessibility testing.
A separate, independent analysis of this program’s raw scoring data corroborates this from a different angle: physical disability, Indigenous, and over-65 testers are specifically the three cohorts whose usability scores lag meaningfully behind their accessibility scores for the same sessions, exactly what we’d expect if their dominant barriers (effort, findability, and confidence, respectively) sit outside what a conformance-style accessibility score is designed to capture. See our companion piece testing the “accessible design is good design” hypothesis for the full breakdown.
Why this changes how “accessibility testing” should be scoped
A testing program that only recruits blind and low-vision participants (the two cohorts most people default to when they hear “accessibility testing”) will reliably catch the operability failures those two groups experience, but will systematically miss the findability failures affecting Indigenous testers, the comprehension failures affecting deaf and limited-English-proficiency testers, the confidence-related friction affecting older testers, and the motor-interaction failures affecting testers with physical disabilities. All four of these patterns were consistently under-represented among accessibility-tagged friction types in this dataset: they surfaced under comprehension, content-not-found, confidence, and excessive-effort respectively, categories a screen-reader-only test plan has no reason to specifically probe for.
Frequently asked questions
Do all disability groups experience the same kind of usability friction?
No. Across this dataset, each cohort shows a distinct “signature” friction type when compared to the average distribution: blind and low-vision testers are overrepresented on accessibility-specific friction, deaf and limited-English-proficiency testers on comprehension friction, Indigenous testers overwhelmingly on content-not-found friction (2.09x average), and testers with physical disabilities on effort and interface responsiveness.
Which cohort shows the strongest single friction pattern in usability testing data?
Indigenous testers, in this dataset: 45.3% of their findings were tagged as “content not found,” a 2.09x overrepresentation compared to the average across all cohorts, the largest single cohort-friction association measured.
Is testing with blind and low-vision users enough to cover accessibility broadly?
Not based on this data. Blind and low-vision testers reliably surface operability and assistive-technology issues, but the comprehension, findability, confidence, and motor-interaction patterns found in other cohorts in this dataset did not register as “accessibility” friction at all: they require testing with a broader range of participants to detect.
About this analysis
Figures in this article are drawn from an anonymised aggregation of 15 independent usability testing projects conducted by See Me Please between late 2025 and mid-2026. Friction-type tagging and cohort assignment were applied during test synthesis by trained reviewers based on task-based sessions; testers who belong to more than one cohort are counted once within each relevant cohort. All client and participant identities have been removed.