
How it works
Your real journey. Real people. Insights in days.
Eighteen people from six perspectives that testing usually leaves out complete your service, start to finish. You watch what gets in their way, and every team knows what to fix first. We aim to deliver within five business days of brief sign-off.
“Link is external. Link is external.”
Our out-of-the-box offering
- diverse participants test your journey
- 18
- Drawn from our own panel of hundreds, in your country.
- from each of our six tester cohort perspectives
- 3
- Three show whether a problem persists, because one person who is blind is just one person.
- business days
- 5
- From brief sign-off to publishing your dedicated research repository.
Not an audit
Universal usability, not a checklist.
An audit asks
Does it pass?
- Alt text is present
- Headings are in order
- Contrast passes
- Written in dense, complex accessibility speak
Useful, and we map every finding to WCAG for when you need the evidence.
We ask
Can people actually use it?
More often than not, the most severe friction affects all six perspectives.
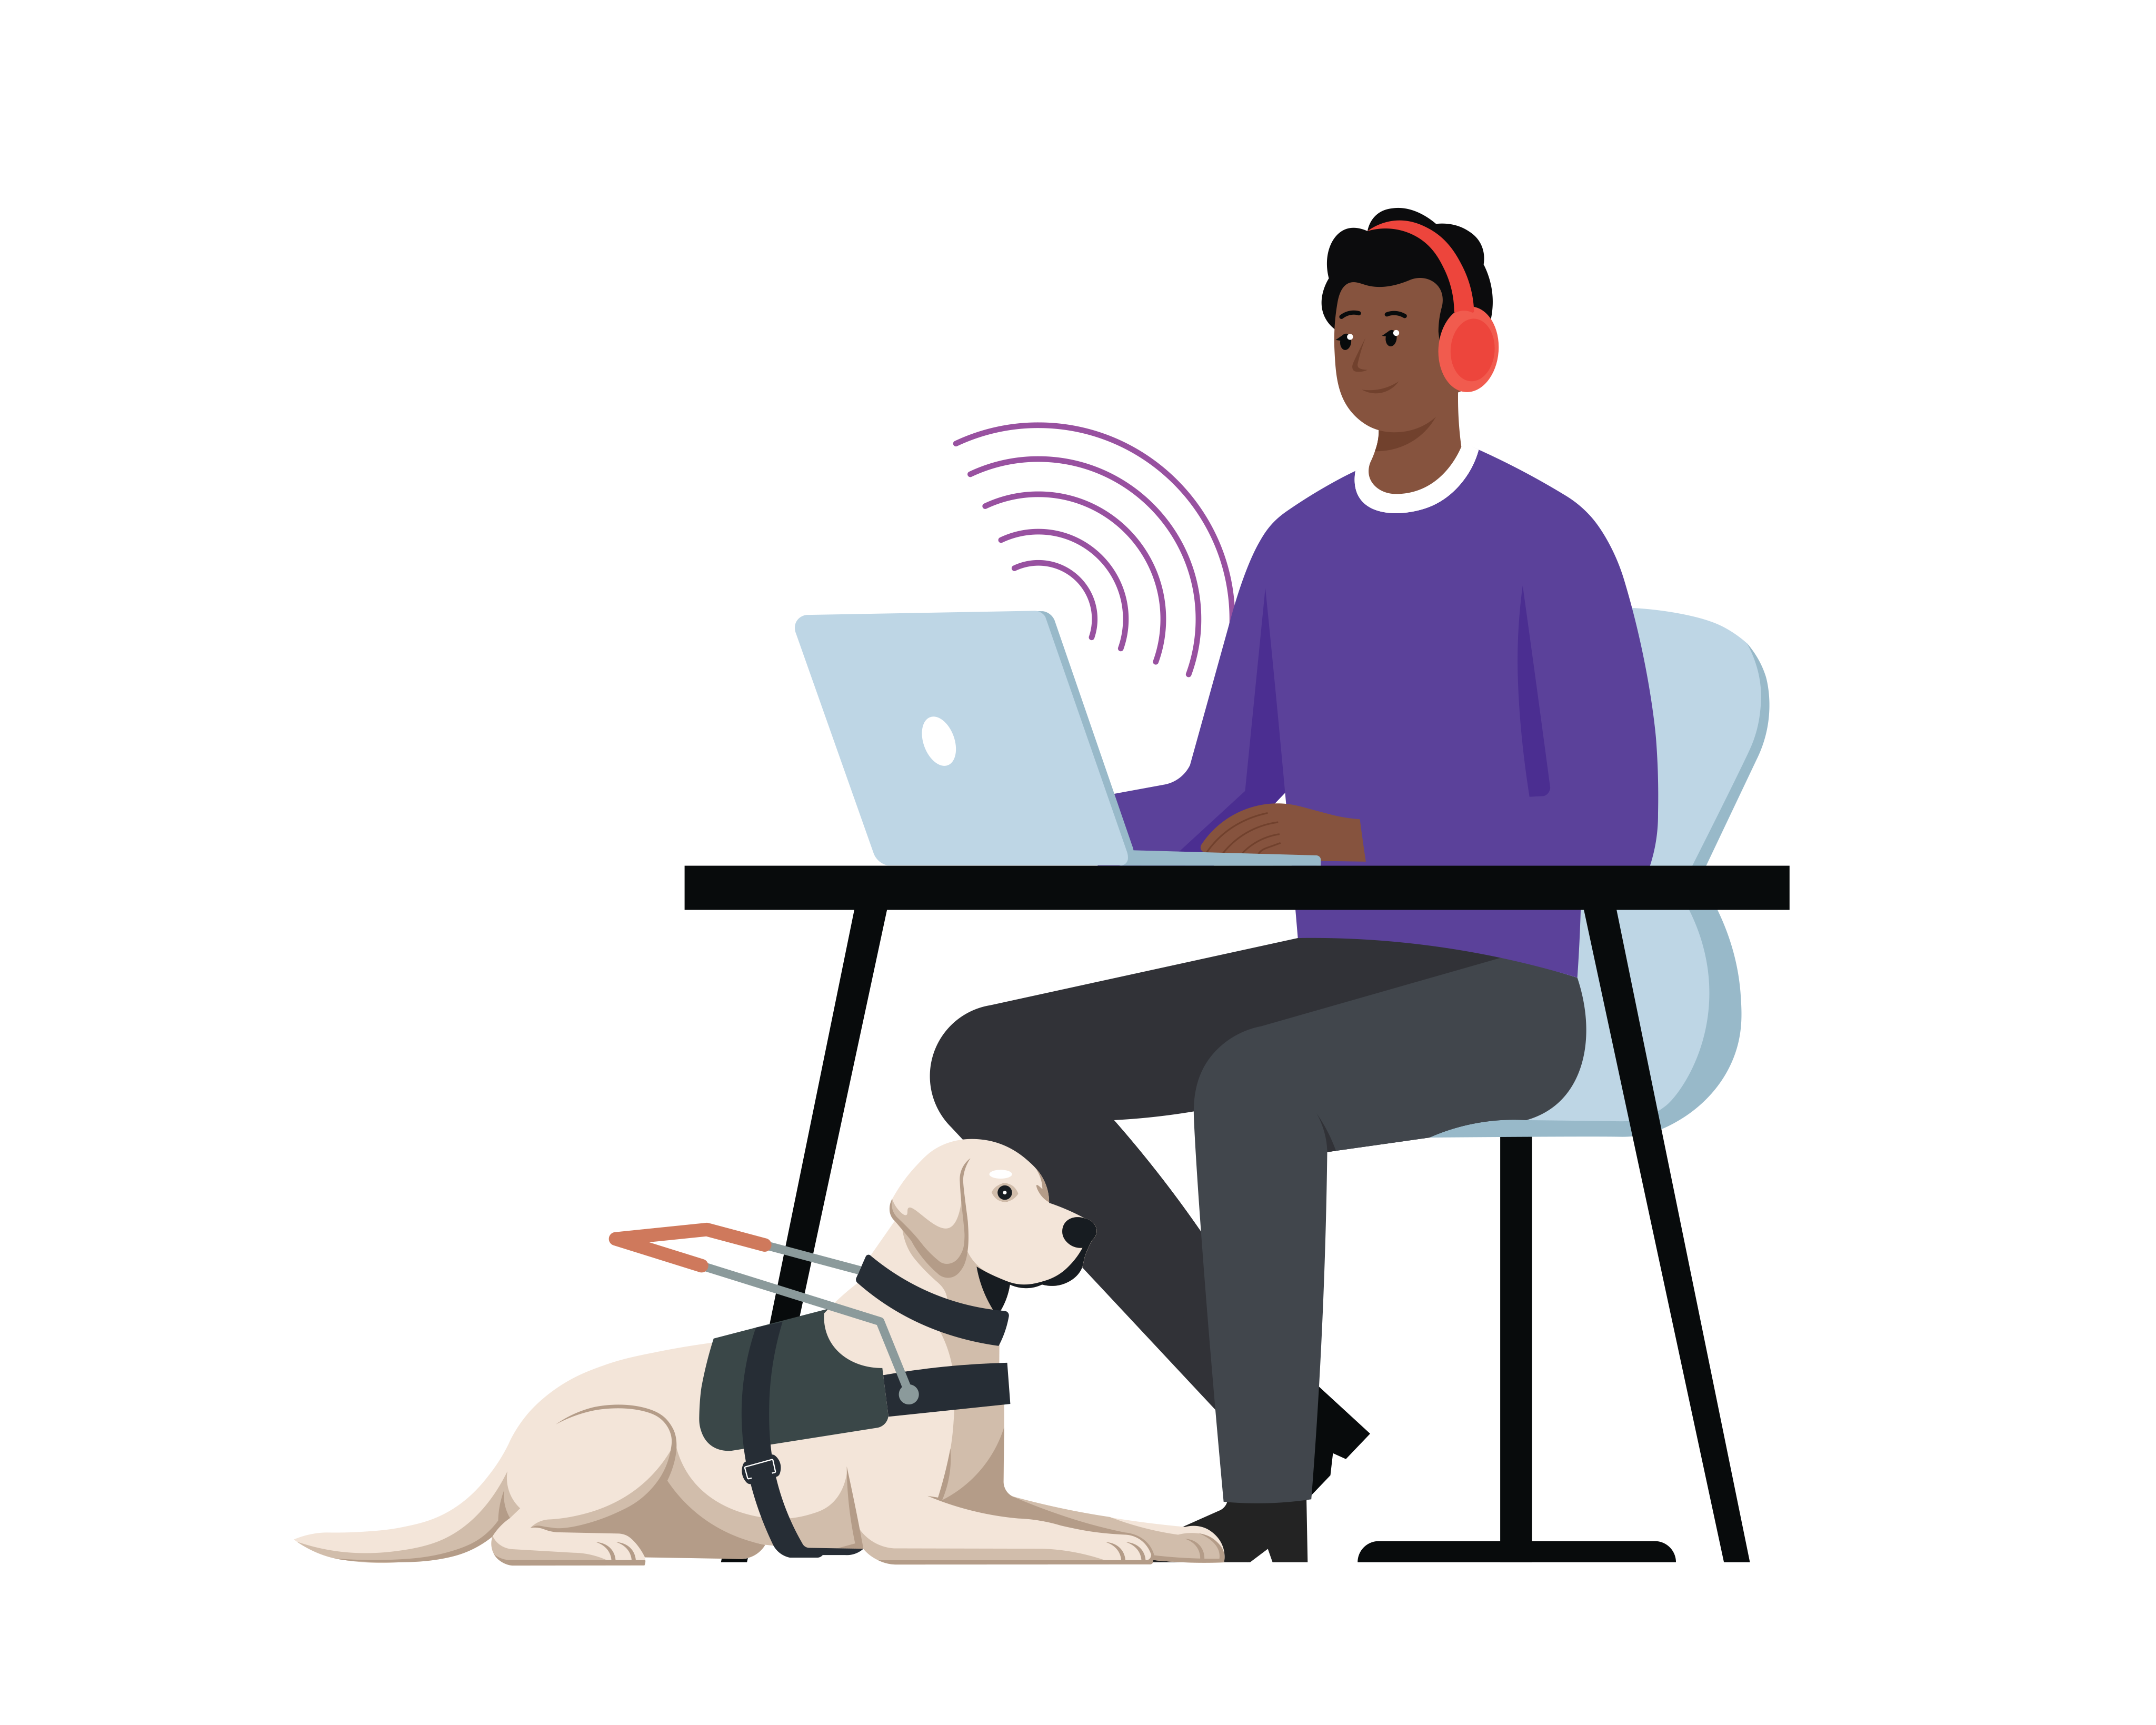
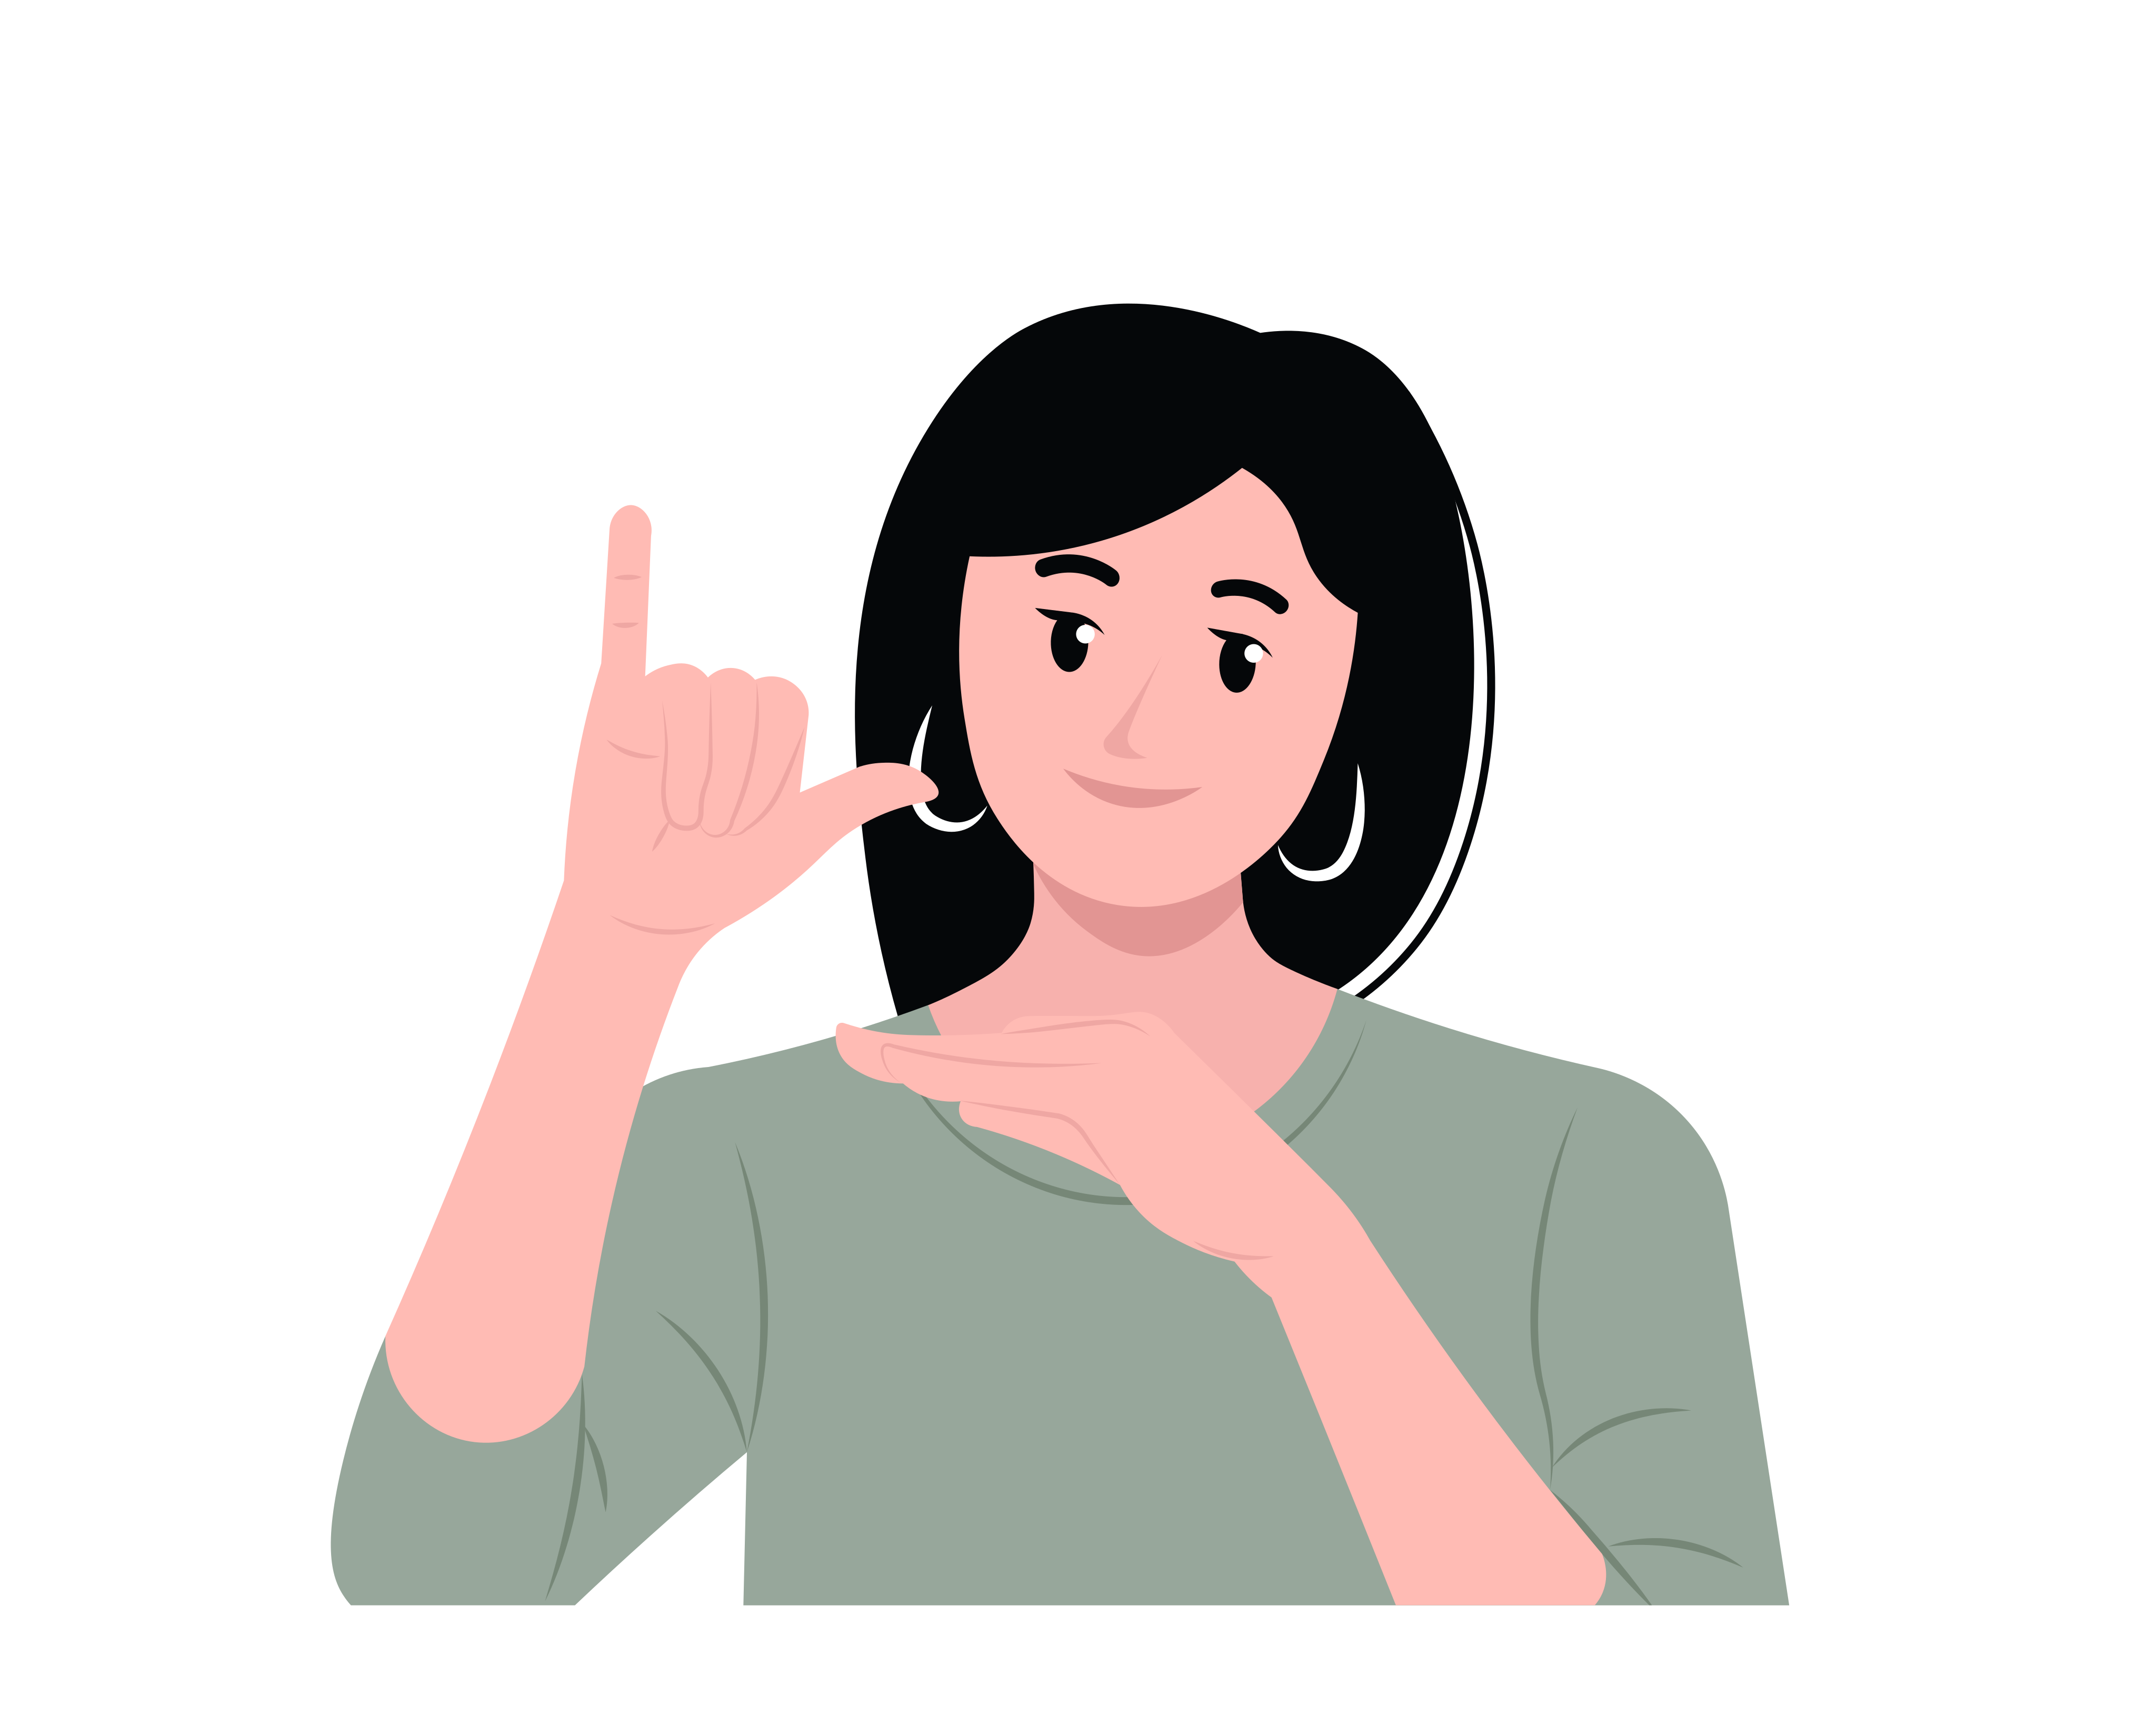
Blind Low vision Deaf Neurodivergent Older than 65 Limited English

That is content, comprehension and service design, magnified. If it works for these customers, it works for everyone.
Five steps
We do the heavy lifting.
It is a managed service. From recruiting to research plan to synthesis, your team spends minutes, not weeks.
- Day1
- Day2
- Day3
- Day4
- Day5
Days 1 to 3
They complete your journey, start to finish
Days 4 and 5
We make meaning of it
Step 1, You, about 20 minutes
Tell us the journey
A link and a sentence, or a 20 minute call. We write the research plan and the tasks. Your team just red-pens them.
Step 2, Us, before day one
We curate your panel
Eighteen people, three from each of six perspectives, across different assistive technologies, devices and settings. Drawn from our own panel of hundreds, in your country.
Step 3, Days 1 to 3
They complete your journey, start to finish
On their own setup, thinking aloud. Moderated or not, whichever gets the best feedback from each person. If someone’s feedback falls short, we add another tester at our cost.
Step 4, Days 4 and 5
We make meaning of it
Researchers review every session, with AI to help find the needle in the haystack. Every moment is tagged by journey step, perspective, severity and friction type.
Step 5, Our aim: day 5
Your research repository, fast
We aim to deliver within five business days of brief sign-off: typically three days of testing and two of synthesis. Everyone in your organisation can log in.
Your panel
Eighteen people. Three from each perspective.
Our panels run to hundreds of people, hired in every country we operate. So there is no geo-blocking, and no feedback from people who don’t know how services work where your customers live.
BlindThree testers What your build really says to a screen reader: unlabelled links, hidden text, focus traps. The same fixes help AI agents read you too.
Low visionThree testers Contrast, zoom, magnification and dark mode. Layouts that break when enlarged.
DeafThree testers Captions, audio-only steps and contact routes that only work by phone.
NeurodivergentThree testers Clutter, confusing flows, time pressure and too many choices at once.
Older than 65Three testers Small targets, jargon and steps that assume a lot of digital confidence.
Limited EnglishThree testers Whether your words are clear, your icons carry meaning and translation actually works.
Why three of each?
One person’s experience can come down to their digital fluency, their device settings, a preference or how they communicate. Three show whether a problem persists, so your limited, expensive refactoring goes on friction that is real.
Why one participant isn’t enoughMeet the six perspectives- One person hits itIt could be their settings, their digital fluency or simply how they like to work.
- Two people hit itA hint worth watching.
- All three hit itA pattern. That is where your refactoring budget should go.
One issue, many faces
The biggest wins are the ones everyone shares.
Different perspectives often hit the same wall for different reasons. When groups with almost nothing in common struggle at the same point, it is one universal issue, magnified. You only see it by testing across all six.
Footnote markers on a quote page hide what is actually covered
Everyone hits it. Fix it once and every customer benefits.
All six perspectives
- Blind participantsHit it
- Participants with low visionHit it
- Deaf participantsHit it
- Neurodivergent participantsHit it
- Participants older than 65Hit it
- Participants with limited EnglishHit it
Dense policy wording stands between people and the price
A content problem, not a technical one. Often a quick win.
4 of 6 perspectives
- Blind participantsGot through
- Participants with low visionGot through
- Deaf participantsHit it
- Neurodivergent participantsHit it
- Participants older than 65Hit it
- Participants with limited EnglishHit it
Links that only say “external link” give no clue where they go
One group, every time. A targeted fix for screen reader users.
1 of 6 perspectives
- Blind participantsHit it
- Participants with low visionGot through
- Deaf participantsGot through
- Neurodivergent participantsGot through
- Participants older than 65Got through
- Participants with limited EnglishGot through
Examples of patterns we see across projects, not one customer’s results.
Seeing is understanding
Nothing in a report replaces watching.
Most designers and engineers have never met someone who is blind. How would they know how a screen reader moves through your service? Video makes complex accessibility simple. It motivates teams to act, and builds their understanding and capability at the same time.
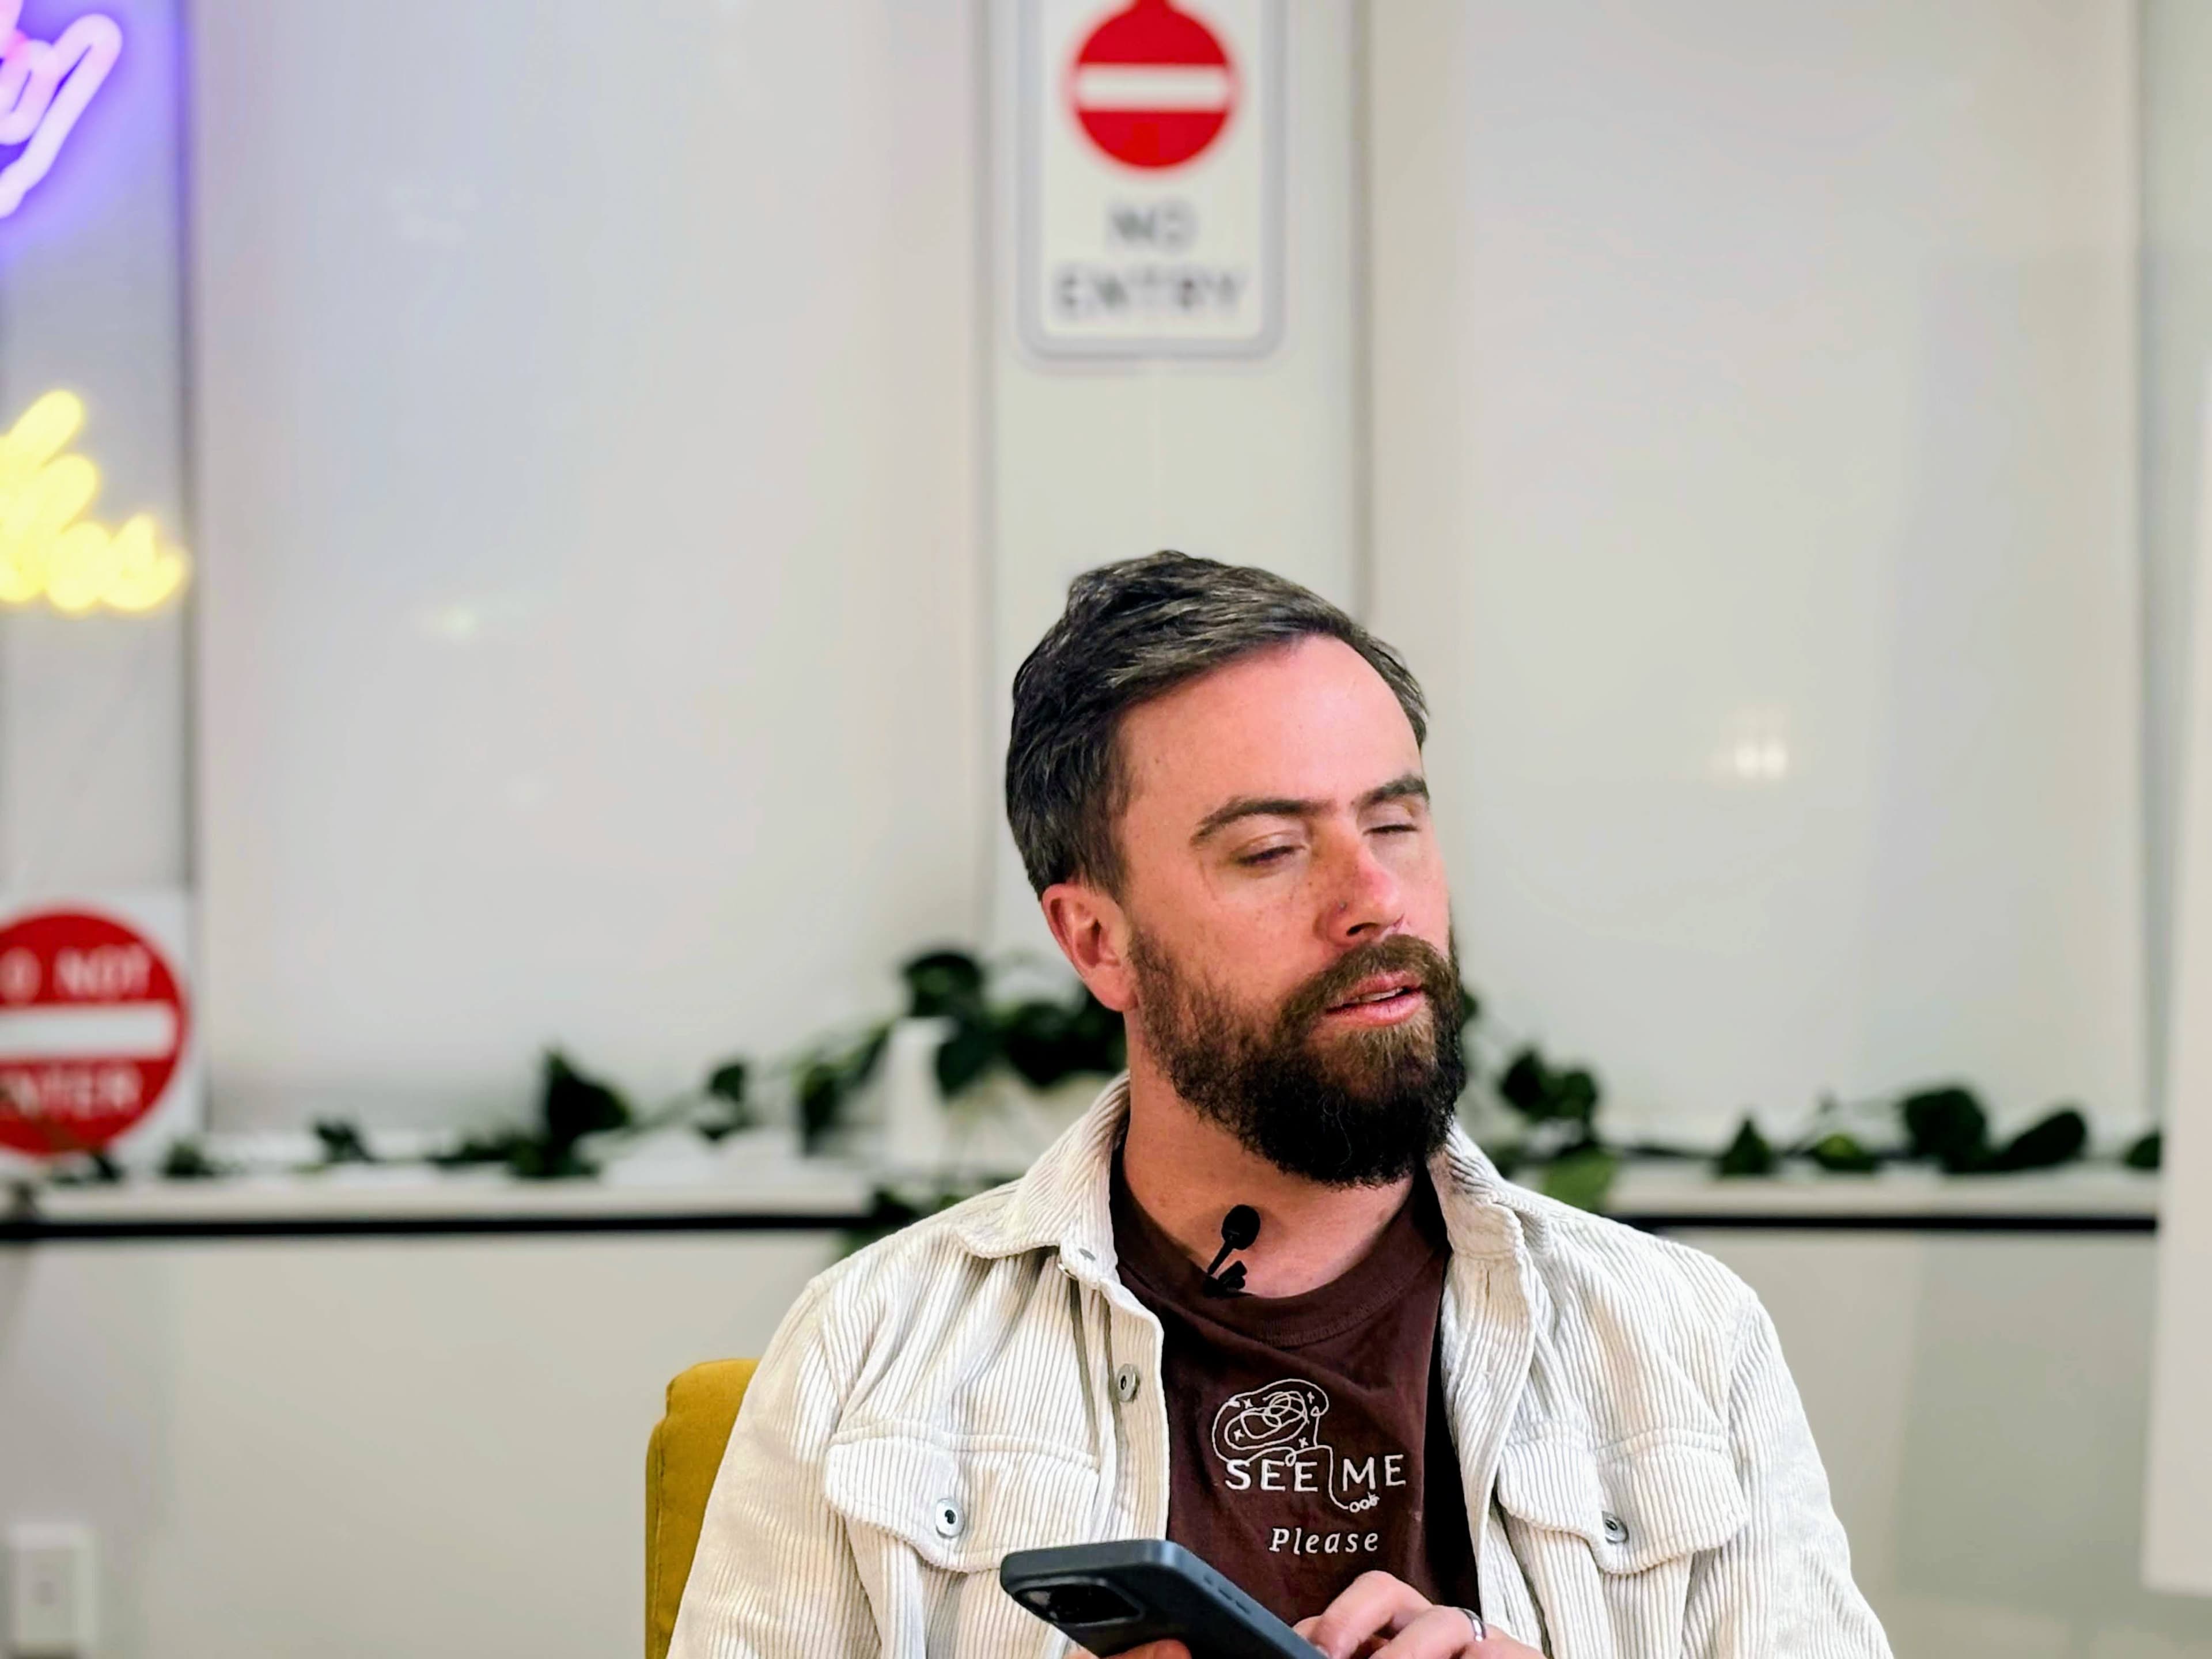
Caption: “Link is external. Link is external. We don’t actually know what we’re clicking on.”
What a report says
Success criterion 2.4.4
Link Purpose (In Context), Level A
Status: Fail. Multiple instances.
Accurate, and easy to skim past.
Scope
A whole journey, not a page.
Real customers move across teams, products and channels. Following one whole journey shows where it breaks, whether the happy path holds up, and the moments people leave the screen.
How we scope a testExample: finding a home loan
- Search the way they normally wouldSome people leave the screen here: Asks an AI
- Land on your site
- Try the calculators
- Compare productsSome people leave the screen here: Calls the contact centre
- Start an application
What you get
A research repository your whole organisation can use.
No licences and no seats. Anyone with your organisation’s email can log in, so one test builds understanding of your customers across every team it touches.
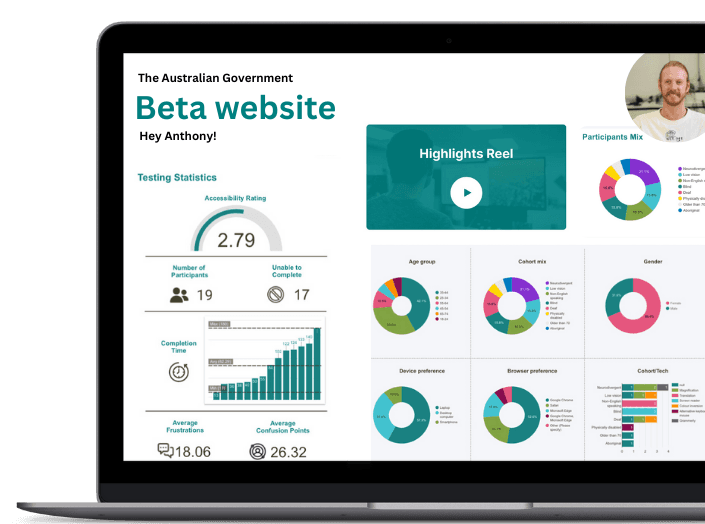
Highlights reel
Five minutes of the moments that matter most, edited by researchers. Built for executives and steering committees.
Chaptered recordings
Every session, unedited, chaptered by task so each team jumps straight to its part.
Insights with clips
What went wrong, how bad it is, who it hurt and what to do about it, beside a short clip of the moment. Quick wins kept separate.
Dashboard and scores
Who took part and how it went for each perspective, with usability and accessibility scored separately.
Good for business
Services people can use are services people choose.
When digital works for everyone, more customers choose it over the phone or a branch. That lowers your cost to serve, and the savings grow with every customer who no longer needs help to get it done.
- digital adoption for services designed really well
- 90%+
- for services that weren’t, with no one able to say why
- 30%
“Some services were adopted by almost everyone. Others got 30%. No one could tell me who was dropping off, or why.”
See it on your own service.
Tell us the journey that matters most. It takes 30 minutes.